The Time I Spent 3 Hours Debugging a gRPC Call Because I Couldn't Read the Binary
I spent three hours debugging a gRPC call once. The response was coming back wrong, and all I had was a hex dump like 08 96 01 12 0B 48 65 6C 6C 6F 20 57 6F 72 6C 64. I knew the data was in there somewhere, but I couldn't see it.
That was when I decided to build the Protobuf Visualizer.
Why Protobuf Exists
Protobuf exists because JSON over HTTP is slow and bulky. If you're building high-performance services—gRPC APIs, Kafka message queues, any real-time system—JSON's text format starts to hurt.
Binary encoding like Protobuf gives you smaller payloads and faster parsing. The tradeoff is that you can't just open a file and read it.
What I Was Debugging
I had a Go service calling a Python gRPC service. The Python side was returning what should have been a user object with ID, name, and email. But my Go code was getting garbage.
After a lot of printf debugging, I captured the raw bytes. I knew the structure—field 1 was the ID (integer), field 2 was the name (string), field 3 was email (string). But staring at hex for 3 hours wasn't getting me anywhere.
What I needed was to see the decoded output. Once I could see "ID: 150, Name: John, Email: [email protected]", I'd know if the Python side was encoding correctly or if my Go side was decoding wrong.
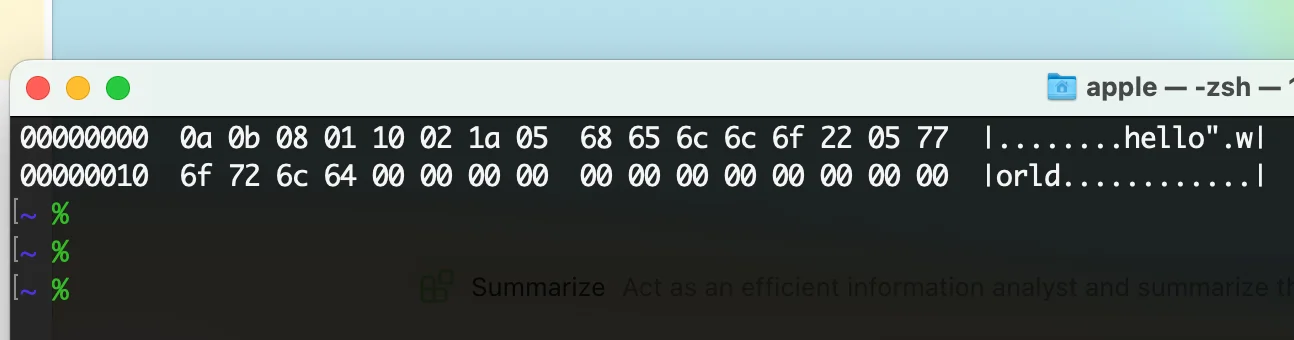
Stared at this hex dump for three hours, eyes nearly went blind, only to find out it was just a wire type mismatch.
What I Tried Before Building the Tool
-
protoc decode: Requires the .proto schema file. I had it, but the workflow was slow—edit proto, recompile, try again.
-
Online Protobuf decoders: Fast, but I was debugging a production issue with real user data. I didn't want to paste that into some third-party site.
-
Writing quick Python scripts: Worked, but took 10-15 minutes each time I wanted to check a new payload.
None of these were great for rapid iteration.
What the Visualizer Does
The Protobuf Visualizer I built:
- Takes Base64 or hex input
- Shows you the decoded fields without needing a schema
- Handles JWT tokens too (same Base64 structure, just JSON inside)
- Runs entirely in your browser, nothing sent to any server
For quick debugging, you don't always need the schema. You just need to see what's in there.
When You Still Need the Schema
Without the .proto schema, you see field numbers and types, not field names. So instead of user_id: 123, you see field_1: 123. You know it's an integer, you can guess what it represents from context.
For full semantic understanding—field names, nested message types, enum values—you need the schema. The visualizer isn't a replacement for proper Protobuf parsing with schema validation. It's for quick looks when you just need to see what's in a payload.
Practical Takeaways
If you're working with gRPC or Kafka:
- Capture payloads as hex or Base64 when something goes wrong
- A visualizer lets you quickly verify what you're actually sending/receiving
- For sensitive data, use local tools—nothing should go to a third party
- Keep your .proto files handy for when you need full decoding
This is the tool I wish I'd had during that 3-hour debugging session. Now I open it, paste the hex, and see the problem in 30 seconds.
Try the Protobuf Visualizer for quick Protobuf and JWT inspection.